Extensive list of options for “running” the triangulation program
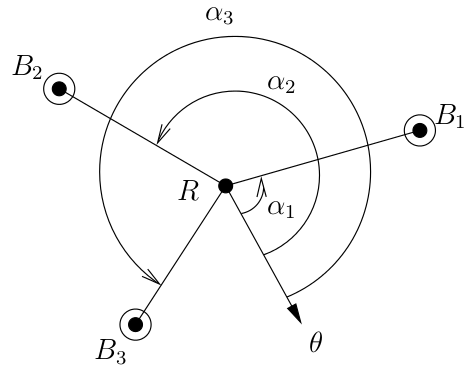
Triangulation setup in the 2D plane. R denotes the robot. B1, B2, and B3 are the beacons. α1, α2, and α3 are the angles for B1, B2, and B3 respectively, relative to the robot reference orientation θ. Our triangulation algorithm computes the robot position and orientation based on these angles.
Please see here for the complete documentation of the package. The “triangulation.zip” package contains all the files necessary to reproduce the results published in V. Pierlot and M. Van Droogenbroeck, A New Three Object Triangulation Algorithm for Mobile Robot Positioning, IEEE Transactions on Robotics, vol. 30, 2014 [1].
1 Options when you run the program
The program provides 8 test modes (from 0 to 7). You can choose the test mode with
option (default=5). Type
for the complete list of options. There are default values for each option, so that you can try easily each test mode. All angles are entered and displayed in degrees, in order to ease the interpretation.
-t
./triangulation -h
for the complete list of options. There are default values for each option, so that you can try easily each test mode. All angles are entered and displayed in degrees, in order to ease the interpretation.
1.1 Common options
Some options are common to all tests. There are the beacon coordinates and the triangulation method to use:
-m
-1
-2
-3
-4
-5
-6
1.2 Test 0
Computes and displays the three angles from the input robot pose (position and orientation). The additional options are:
-x
-y
-o
1.3 Test 1
Triangulates and displays the robot pose (position and orientation) from the three input angles. The additional options are:
-a
-b
-c
1.4 Test 2
Computes the three angles from the input robot pose (position and orientation) and triangulates from the computed angles. The additional options are the same as for the test 0.
1.5 Test 3
Measures and displays the execution time of “n” runs of the triangulation method “m”. The additional options are:
-n
1.6 Test 4
Runs the angle sensitivity analysis for a given robot pose. It analyzes how the computed robot pose is affected by noisy angles. The robot pose is entered like for the test 0. The additional options are:
-n
-s
-T
1.7 Test 5
Runs the angle sensitivity analysis in the square grid [ − S, E] × [ − S, E]. It analyzes how the computed robot pose is affected by noisy angles. This test creates a p × p PGM image, and the corresponding scale PGM image in the current directory. The additional options are the same as for the test 4, plus:
-S
-E
-p
-M
1.8 Test 6
Runs the beacon positions sensitivity analysis for a given robot pose. It analyzes how the computed robot pose is affected by noisy beacon coordinates. The options are the same as for the test 4, except that
represents the standard deviation of the Gaussian noise applied to beacon coordinates.
-s
1.9 Test 7
Runs the beacon positions sensitivity analysis in the square grid [ − S, E] × [ − S, E]. It analyzes how the computed robot pose is affected by noisy beacon coordinates. This test creates a p × p PGM image, and the corresponding scale PGM image in the current directory. The additional options are the same as for the test 5.
2 Simulations
To reproduce the figures given in the paper, run the command with the arguments as mentioned under each corresponding figure:
|
|
|
|
|
|
|
|
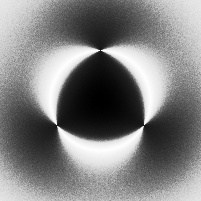
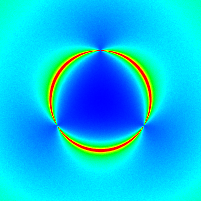
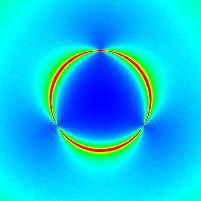
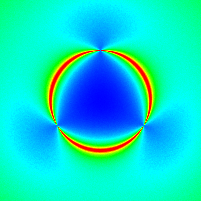
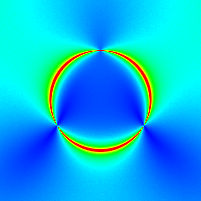
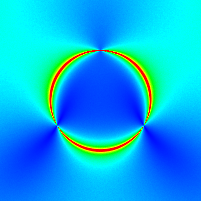
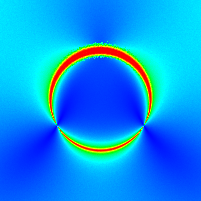
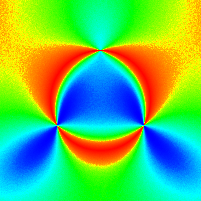
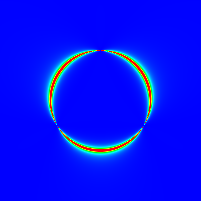
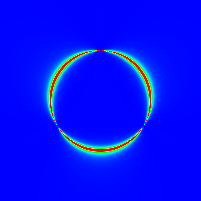
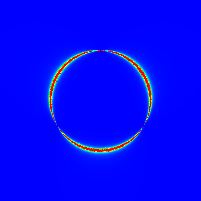
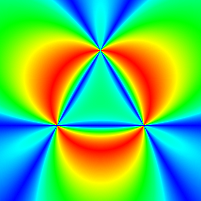
| ./triangulation -t5 -M4 -s"0.01" -T1 -n1000 | ./triangulation -t5 -M4 -s"0.1" -T1 -n1000 | ./triangulation -t5 -M4 -s"1.0" -T1 -n1000 | ./triangulation -t5 -M2 -s"0.1" -T1 -n1000 |
|
|

|
|
|
|
|
|
| ./triangulation -t5 -M4 -s"0.01" -T2 -n1000 | ./triangulation -t5 -M4 -s"0.1" -T2 -n1000 | ./triangulation -t5 -M4 -s"1.0" -T2 -n1000 | ./triangulation -t5 -M2 -s"0.1" -T2 -n1000 |

|

|

|

|
|
|
|
|
| ./triangulation -t5 -M4 -s"0.01" -T3 -n1000 | ./triangulation -t5 -M4 -s"0.1" -T3 -n1000 | ./triangulation -t5 -M4 -s"1.0" -T3 -n1000 | ./triangulation -t5 -M2 -s"0.1" -T3 -n1000 |
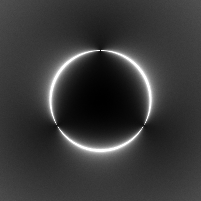
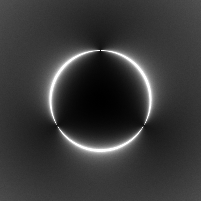
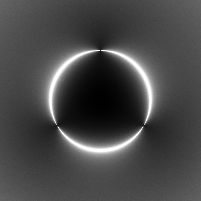
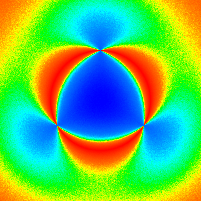
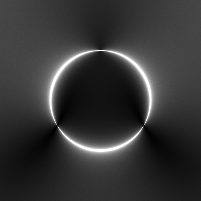
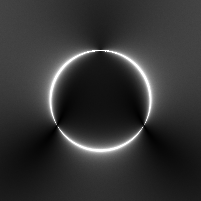
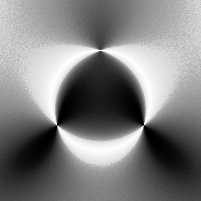
Figure 2 Simulation results giving the position and orientation errors for noisy angle measurements. The beacon positions are represented by black and white dot patterns. The first, second, and third columns provide the results for σ = 0.01 deg, σ = 0.1 deg, and σ = 1 deg respectively. Position errors are expressed in meters, the orientation error is expressed in degrees, and the error measure 1⁄|D| is in 1 ⁄ m2. The last column shows the results for σ = 0.1 deg; they are identical to that of the second column but after an histogram equalization to enhance its visual representation and interpretation.
3 Copyrights and license
All rights reserved by Vincent Pierlot and Marc Van Droogenbroeck.
You are allowed to use the programs and the source code for educational purposes and for your own usage only.
Distribution or any form of commercial usage is strictly prohibited. Please contact the authors if you want to use the program or source code outside the scope of the authorized usage.
References
[1] . A New Three Object Triangulation Algorithm for Mobile Robot Positioning. IEEE Transactions on Robotics, 30(3):566-577, 2014. URL http://dx.doi.org/10.1109/TRO.2013.2294061.